

Unlike Microsoft Excel, Microsoft Power BI doesn’t have the ability to build custom sorts. However, you can sort one column by another, which is effectively the same thing and easy to implement.
In this tutorial, I will show you how to sort a Power BI column by another column. I’m using Microsoft Power BI Desktop on a Windows 11 64-bit system, but you can also use the Microsoft Power BI service. You can download the Microsoft Power BI demo file for this tutorial.
Jump to:
- How to recognize the need to sort by another column in Power BI
- How to add a month number field in Power BI
- How to sort one column by another in Power BI
- Power BI tutorials and resources
How to recognize the need to sort by another column in Power BI
You might be wondering why you can’t sort by the month numbers if they’re available. This is because you can’t sort a visualization by a field that isn’t in the visualization in Power BI.
SEE: Here’s everything you need to know about Microsoft Power BI.
Currently, the dataset has two columns, Month and Sales. If you take a quick look at the dataset in Table View, you can see that the Month field is text (Figure A).
Figure A

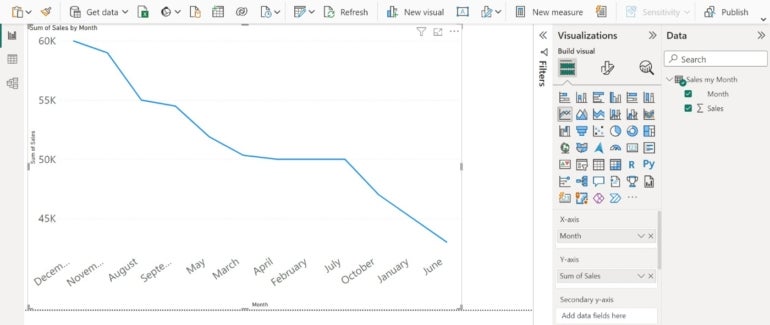
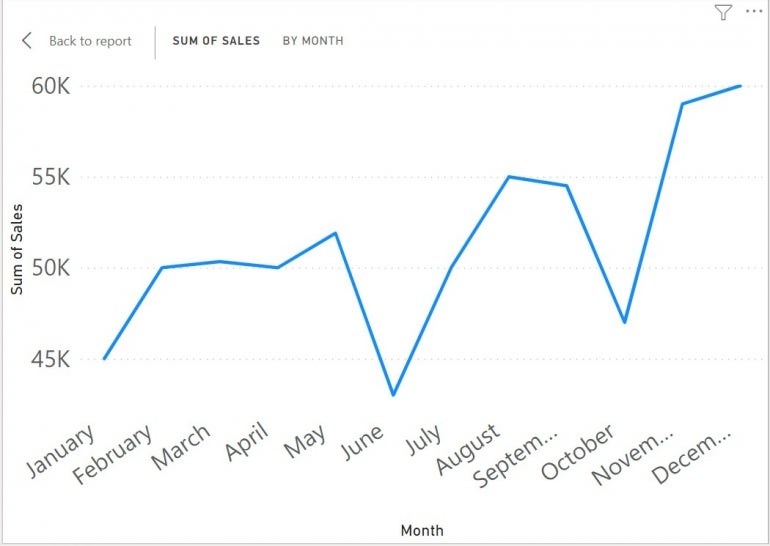
Sorting alphabetically and numerically is usually an adequate approach. However, sometimes a sort by the actual values doesn’t work. Figure B shows a line chart based on twelve records — monthly sales.
Figure B
This file contains only one table, which means the file is relying on the Auto Date table. The example is simple on purpose because we’ll be working at the table level. There’s no need for extraneous tables, data and relationships.
SEE: Discover how to create a calculated table of top values in Microsoft Power BI.
The Month column is in the X-axis bucket, and Sales is in the Y-axis bucket. By default, the visualization sorts by the sales value, which makes a mess of the month order along the X-axis. As is, the visualization is misleading. If you weren’t paying attention, you’d think your sales were going downhill fast.
You might try to fix the month sort by resorting on the visualization as follows:
1. Click the More Options icon, which is the three dots. These icons tend to move around, so they could be at the top or bottom right of your visualization.
2. Choose Sort Axis. As you can see in Figure C, Sum of Sales is the default. Power BI adds “Sum of” because it’s a numeric field.
Figure C
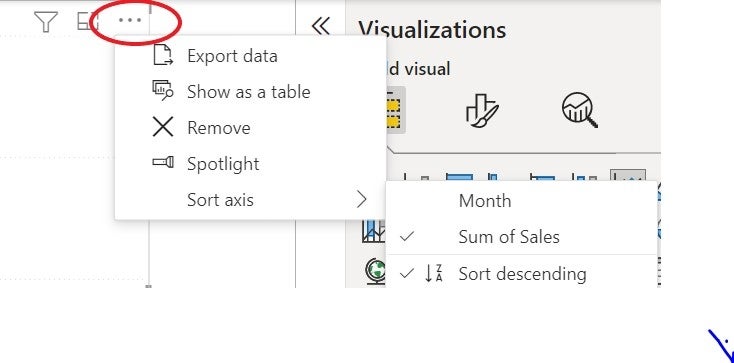
3. Choose Month from the submenu to resort the X-axis — the months.
At first glance, the chart shown in Figure D appears more reasonable, showing ups and downs, but look closer. Power BI sorted the months alphabetically and in descending order. Unless you’re paying attention, the results are misleading. We need to sort months chronologically in order to get meaningful results. But how do we get to them?
Figure D

How to add a month number field in Power BI
We’ve established that a regular sort won’t sort the months in chronological order. The next step is to find a way to force a monthly sort, and it comes in the form of a number: The month number where January is 1, February is 2, March is 3 and through December, which is 12.
If you’re lucky, the table already contains the month number. If that’s the case for you, you’ll simply sort by the month number field, and you’re done.
SEE: Learn how to add a year-to-date running total in Microsoft Power BI.
In most real-world examples, the data isn’t that perfect. Our model is a good example, because the table doesn’t contain a month number in the Sales By Month table. To make matters worse, the month value we do have is text, not a date that we can grab the month value from.
It’s nearly impossible to add a calculated column that returns the month number but also doesn’t return a circular reference error when you try to sort. A measure won’t work because the timing is off. For this technique to work, you must add a new column to the table for month numbers. Both the month name field and the month number field must share granularity or level.
Adding an index column in Power BI
To make this work, we must add a new column and populate it with the right values. Specifically, we’ll run a query that will add an index column.
Before doing so, the original data or the month names must be in chronological order. We’re in good shape because our records are in chronological order by month name. That won’t always be the case, so it’s important to pay close attention to how your dataset looks before you start.
To add an index column, run a simple query as follows:
1. Right-click Sales By Month in the Data pane, and choose Edit Query from the resulting submenu (Figure E).
Figure E

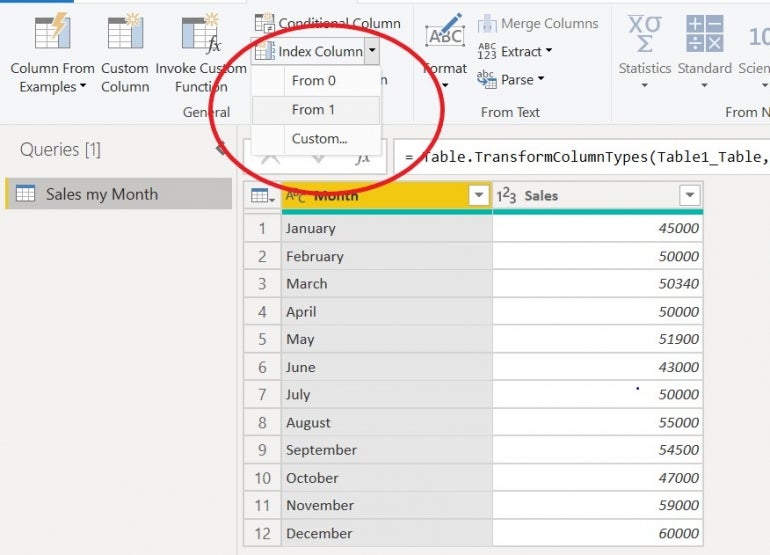
2. In the resulting query window, click the Add Column tab.
3. In the General group, click the Index Column dropdown, and choose From One (Figure F).
Figure F
4. Close the query, and save when prompted.
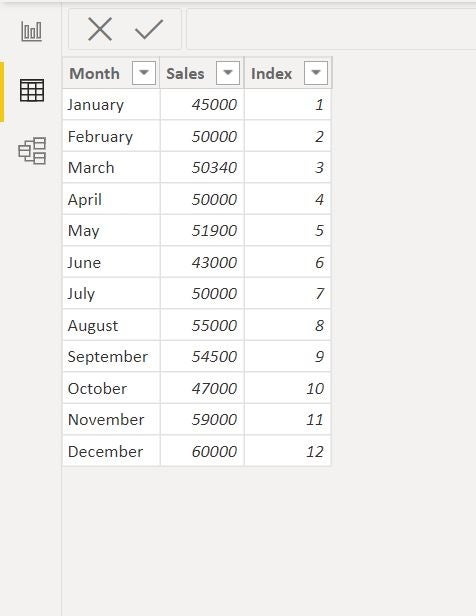
As you can see in Figure G, the table now has a column of consecutive numbers beginning with 1 that corresponds to the month name. At this point, rename the column Monthly Numbers. Technically, this step isn’t necessary, but I recommend you give the column a meaningful name to make the data easier for all relevant users to decipher.
Figure G
SEE: Learn how to add action buttons to a report in Microsoft Power BI.
If the months are not in chronological order
It’s worth noting again that the month names must be in chronological order for this to work, January, February, March and so on. If you find yourself in a situation where your month names aren’t listed chronologically, you can:
1. Copy the table into an Excel sheet, and create a custom sort that sorts the month names in chronological order.
2. While in Excel, go ahead and enter the corresponding month numbers.
3. Then, import the data back into Power BI, and you’re ready to go. You won’t even have to run the index query because the month numbers are in the dataset.
For our example, we won’t need to take these steps in Excel because our month names are already in chronological order.
SEE: Here’s how to export Power BI data to Excel.
How to sort one column by another in Power BI
Adding the field of month numbers doesn’t do anything to the visualization. Remember, we can sort by only two fields in the visualization: Month and Sales. The new column isn’t in the visualization, and if you try to add it, you will make a mess. We must find another way to sort and fix the data visualization.
To push the sort into the visualization, do the following:
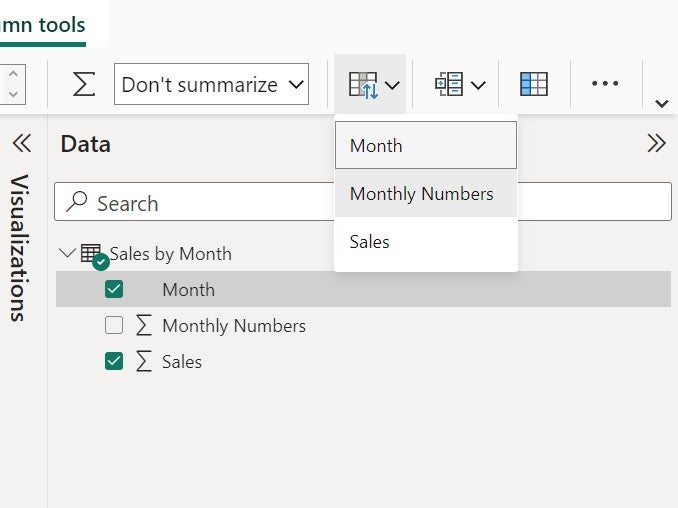
1. In the Data pane, select the field you’re sorting, which is Months. You want to see the month names in chronological order.
2. In the contextual Sort group, click the Sort By Column dropdown, and choose Monthly Number (Figure H).
Figure H
3. The results show the months in chronological, descending order. To fix this, click More Options, and choose Ascending Order. Figure I shows the results.
Figure I
SEE: Use your new knowledge to create a custom security and threat dashboard in Power BI.
The months are finally in chronological order. The first chart’s ill-represented data made it look like the business had a horrible year, but now it’s clear that after a couple of dips, business is booming. If you sort by the visualization’s options, Month or Sum Of Sales, you won’t lose anything because the underlying sort is by the Monthly Number values.
If you import an updated table later, remember to add the index column or you’ll lose the sort functionality.
If an update includes months for the next year, this technique won’t work because it doesn’t consider the year when sorting. In this case, you’d need a month number field that contains the month number and year.
With that, you now have the necessary steps and resources to sort a Power BI column by another column.
Power BI tutorials and resources
Power BI is one of the most widely-used and effective business intelligence tools on the market, but like many other enterprise software solutions, the number of features and functions can be overwhelming to the typical user. We’ve pulled together the following top tutorials, training courses and other resources to help Power BI users get the most out of their business intelligence tool sets:
- The Complete Microsoft Power BI Super Bundle (TechRepublic Academy)
- Visual Storytelling with Power BI Course (TechRepublic Academy)
- How to Use Microsoft Lists with Power BI (TechRepublic)
- Up and Running with Power BI Desktop Course (TechRepublic Academy)
- How to create a date table in Microsoft Power BI (TechRepublic)
If you’re not finding the right resources in this list or among our other Big Data resources, we’d love to hear what questions you have and what tutorial topics we should cover next. Use the contact form below to reach out if interested.
Read next: Explore our list of the best business intelligence tools.

Subscribe to the Data Insider Newsletter
Learn the latest news and best practices about data science, big data analytics, artificial intelligence, data security, and more.
Delivered Mondays and Thursdays