


Calculating a year-to-date total is a common task when tracking income, and fortunately, it’s easy to add to a Power BI report. It’s a type of running total — a continually adjusting total that adds and subtracts values as they occur for a specific year. When you need such totals, don’t scour the internet for the Data Analysis Expressions code because quick measures are available for both types of running totals.
In this tutorial, I’ll show you how to add a simple running total and a YTD total to a simple dataset in Power BI. I’m using Microsoft Power BI on a Windows 11 64-bit system with a simple .pbix demonstration file you can download. If you want to start from scratch, you can download the .xlsx file that contains the data, which you can then import into Power BI.
Jump to:
- How to prepare the data set in Power BI
- How to calculate a simple running total in Power BI
- How to calculate a YTD total in Power BI
How to prepare the data set in Power BI
For demonstration purposes, we’ll work with a simple dataset that contains a column of unique dates. You can work with your own data if you prefer, but the demonstration dates are unique, which will make a difference. When working with your own data, you probably don’t need to add the Date table; most likely, it already exists within your Power BI file.
SEE: Here’s what you need to know about Microsoft Power Platform.
Figure A shows the relationship between the facts table, Sales, and a custom date table, Date. Specifically, there’s a one-to-one relationship between Sales Date (Sales table) and Date (Date table).
Figure A

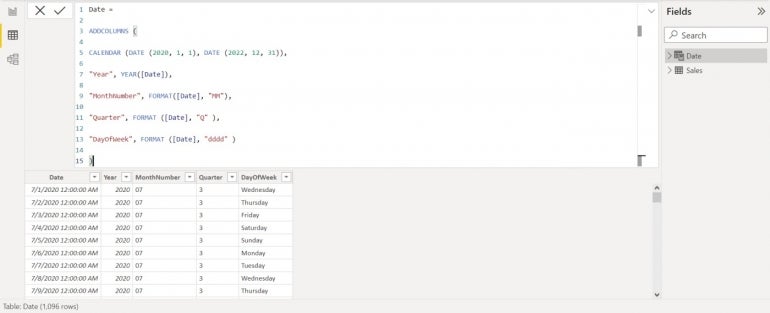
Figure B shows the function in Listing A used to create the date table.
Figure B
Listing A
Date =

ADDCOLUMNS (

     CALENDAR (DATE (2020, 1, 1), DATE (2022, 12, 31)),

     "Year", YEAR([Date]),

     "MonthNumber", FORMAT([Date], "MM"),

     "Quarter", FORMAT ([Date], "Q" ),

     "DayOfWeek", FORMAT ([Date], "dddd" )

)
The most important part of the date table is the YEAR function, which returns the years 2021 through 2022 because the facts table contains dates for the years 2021 and 2022. It isn’t necessary to include 2020, as we did using the CALENDAR function, but it doesn’t hurt to do so. However, you must accommodate the existing year values in your data for this to work correctly when creating your own date table.
If you’re not familiar with the date table, you might want to read How to know if the Auto date table is adequate when using Power BI or How to create a date table in Microsoft Power BI.
With the tables and relationship in place, you’re ready to start analyzing the data.
SEE: Learn how to create a dashboard in Power BI.
How to calculate a simple running total in Power BI
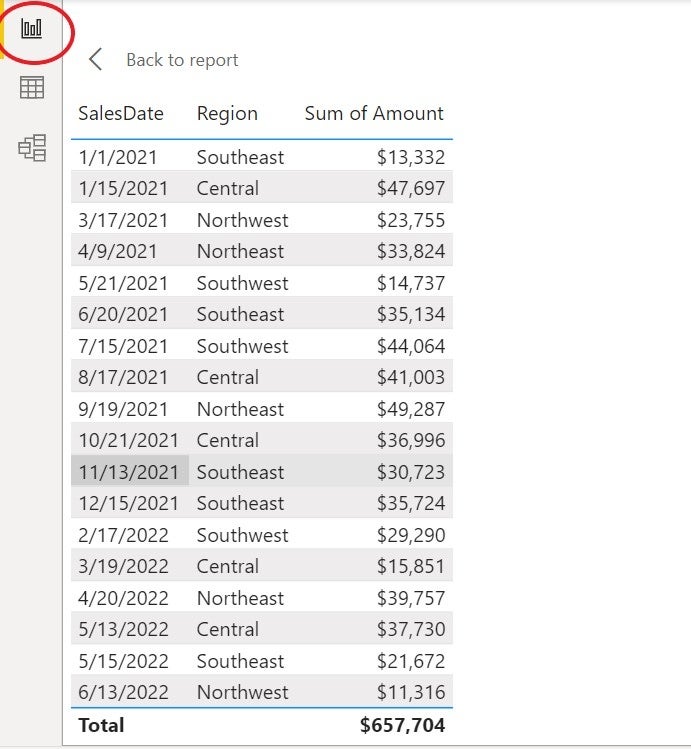
Now, let’s suppose you’re asked to add a running total to the simple table visualization shown in Figure C. You might try to create the necessary DAX code yourself, but that’s not necessary because Power BI has a quick measure that will calculate a running total.
Figure C
To add a running total measure to the dataset, do the following in Report view:
1. Click the Sales table in the Data pane to add the measure to this table.
2. Click the Table Tools contextual tab.
3. In the Calculations group, click Quick Measure.
4. In the resulting dialog, choose Running Total from the Calculation dropdown.
5. Expand the Sales table (to the right) in the Data pane, if necessary, and add the Amount field to the Base Value bucket.
6. Add the SalesDate field to the Field bucket (Figure D).
Figure D

7. Click Add.
Power BI adds the quick measure to the Sales table (Figure E). Add the quick measure to the table visualization by checking it in the Data pane. To see the DAX code, click the formula bar’s dropdown arrow. As you can see, the new column adds the current value to the previous total for every record.
Figure E

SEE: Discover how to add a calculated column in Microsoft Power BI.
Explore the underlying DAX code
The quick measure is much easier to implement than the code, so let’s take a minute to see how the underlying DAX code works:
- The first line is the default name, which you can change by right-clicking the measure in the Data pane and choosing Rename.
- The SUM function evaluates the Amount field in the Sales table, which you specified when creating the quick measure.
- The FILTER function might be a bit of a surprise, but it’s the ISONORAFTER function that does the heavy lifting by specifying the current value and all those above.
There’s certainly a lot going on. That’s why I recommend checking quick measures before trying to write DAX code yourself.
Now, let’s see what Power BI has to offer in the way of returning a YTD column.
SEE: Tackle DAX basics in Microsoft Power BI.
How to calculate a YTD total in Power BI
A YTD total evaluates values with the same year value. We’ll be using another quick measure, which will reset to 0 and start over when encountering a new year value. It’s similar to a running total, but it’s a series of running totals rather than one continuous running total. Fortunately, it’s just as easy to create as the running total:
1. Click the Sales table in the Data pane to add the measure to this table.
2. Click the Table Tools contextual tab.
3. In the Calculations group, click Quick Measure.
4. In the resulting dialog, choose Year-To-Date Total from the Calculation dropdown.
5. Expand the Sales table (to the right), and add the Amount field to the Base Value bucket.
6. Expand the Date table, and add Date to the Field bucket (Figure F).
Figure F

7. Click Add.
Add the new measure, Amount YTD, to the visualization (Figure G). Notice that the returned values are the same as those in the running totals column until the date 2/17/22. That’s because the year changed from 2021 to 2022.
Figure G

Interestingly, the DAX code is much simpler this time:
- The first line is the measure’s default name.
- The second line uses the TOTALYTD function to calculate the Amount values by the year.
SEE: Learn how to add quick measures for complex calculations in Microsoft Power BI Desktop.
You might have noticed that the simple running total measure pulls amounts and dates from the Sales table and that the YTD running total pulls amounts from the Sales table and dates from the Date table. That’s because there are no year values in the facts table, Sales. That’s where the relationship discussed at the beginning of this article comes into play.
The truth is, the simple running total could also use the Date column from the Data table. In fact, if you have duplicate dates, you should do so if you want a simple running total.
If you have duplicate dates in the facts table and you use the SalesDate column in the facts table, the measure will start over at the duplicate date, returning a running total within a running total. That may or may not be what you want, so it’s important that you understand how the relationship between the two tables works when adding a running total.
I recommend you always check what quick measures are available before you try to write DAX code yourself. You might be surprised at how much they can do.

Subscribe to the Data Insider Newsletter
Learn the latest news and best practices about data science, big data analytics, artificial intelligence, data security, and more.
Delivered Mondays and Thursdays